Ethnic slurs on Twitter in the US: Social listening study

Racism. The ugly downside of privilege.
Although the Internet offers a whole slew of other notions, understanding racism is harder than it seems.
By way of example, Urban Dictionary’s most upvoted definition of racism is Pure Bullshit, which speaks volumes of how tricky it is to talk about it.
What’s even trickier is measuring it. People aren’t eager to confess their racial prejudices to a random interviewer’s face because we tend to under-report our bad behaviors. This is known as social desirability bias — the phenomenon that makes assessing the extent of racism nearly impossible.
In an attempt to hack this, researchers started turning to social listening data before it became a thing.
Google Trends to Twitter (and back) — different sources have been used to analyze people’s online behaviors and thereby map racism.
The results were never black-and-white (ironically, these two are the most well-studied groups). Therefore, we at Awario couldn’t help but use the powers of social media listening and conduct a study of our own.
The way we did it is by setting up location-based monitoring of mentions of 6 non-majority backgrounds on Twitter:
- black,
- Hispanic,
- Asian,
- American Indian,
- Jewish,
- Arab.
The alerts featured both politically correct and derogatory terms used in tweets all across the United States. In 50 days (16 October to 4 November 2019), Awario fetched over 83K geotagged mentions that we then sorted and color-coded by state.
The results turned out to be much farther from what we expected. Let’s take a closer look.
DISCLAIMER: This study is not intended to provide a comprehensive overview of racism in the U.S. This is an analysis of the usage of racial slurs vs. race-conscious terms on Twitter only, over a limited period of time. The analysis is a demonstration of the research functionality of the social listening tool Awario. The data, opinions, and results provided here serve informational purposes only.
Methodology
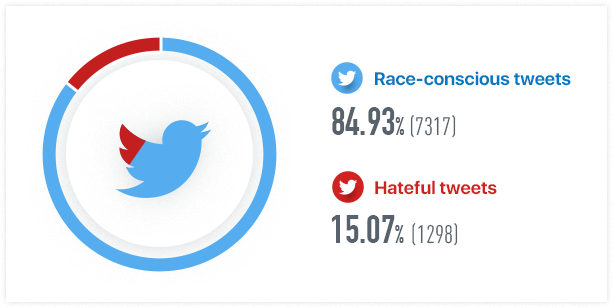
To determine the most and least racist U.S. states, we collected tweets featuring neutral terminology and tweets containing racial slurs. We then calculated the share of hateful tweets in the total volume of tweets per state.
Say, in California, there were 7317 race-conscious tweets vs. 1298 tweets containing racial slurs. Therefore, the share of hateful tweets in California is 1298/(7317+1298) = 15.07%.
We also set a limit of one mention per author, so that the results would not get distorted because of multiple tweets by one and the same person.
With shares for each state + District of Columbia on hand, we were able to rank them from least to most racist. For ease of interpretation, we color-coded the map — green to red, depending on how intense Twitter users were.
Backed by solid social listening data, we hereby present a map of least and most racist U.S. states.
10 U.S. states with the most ethnic slurs
- Delaware (21.4% of all race-related tweets contained slurs)
- South Dakota (20%)
- Maine (19.25%)
- Mississippi (18.59%)
- Hawaii (17.06%)
- Kansas (16.95%)
- Wisconsin (16.95%)
- Arkansas (16.83%)
- West Virginia (16.78%)
- Maryland (16.59%)
As far as hateful tweets go, a little (state) goes a long way.
Size-matters jokes aside, Delaware, USA’s second smallest state, emerged as the most racist on Twitter, with hate speech detected in one-fifth of all race-related tweets.
Worth noting is the fact that we got a narrow range here — 4.81%, with 10 states fitting in. Therefore, it would be unfair to call out any single state. And even though a good chunk of outright racist Twitter users seem to be distributed evenly across the East Coast, let’s not jump at conclusions too fast, shall we?
10 U.S. states with the fewest ethnic slurs
- Vermont (6.96% of all race-related tweets contained slurs)
- New Hampshire (11.56%)
- Alaska (11.59%)
- Texas (12.46%)
- Wyoming (12.49%)
- North Dakota (13.08%)
- Massachusetts (13.24%)
- Michigan (13.5%)
- New York (13.6%)
- Georgia (13.69%)
While 2.9% was basically all that separated most and least racist U.S. states on Twitter, things got more interesting as we moved further up.
Let’s take a moment and appreciate the range: 13.69% all the way to 6.96%. Twitter users from Vermont seem to have earned their state all the points, with under 7% of slurs in all race-related tweets.
Whether or not this was a friendly comeback at the neighboring states, many of which made the Hateful st8 list, Vermont did exceptionally well, singlehandedly expanding our comparison scale by 5%.
What did we learn?
Hard to say. There seemed to be no logic as to what part of the U.S. was most race-hateful during the 50 days we covered. Residents of most and least racist states shared the East Coast (and Twitter space) more comfortably than one would expect.
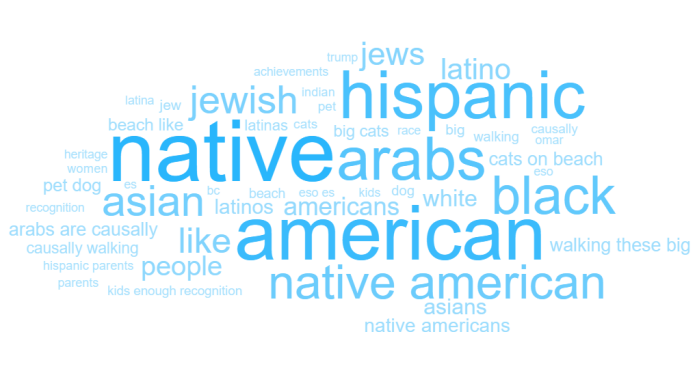
They also shared universal human concerns. Recognition, achievements, Trump, cats were all featured in Topic clouds across the alerts we set up.
 Screenshot taken from Awario
You heard it right. Even the Internet’s fascination with felines can take a racist turn. And it did.
So Arabs are causally walking these Big Cats on the beach like its their Pet Dog ? pic.twitter.com/DCYeR4U8L3
— M (@wolfxmobz1) November 16, 2019
Typically, Russians, never featured as a keyword in any of our alerts, managed to make an appearance as well.
Russians might be out doing Arabs when it comes to exotic animals. It be regular ass people with mountain cats and shit
— YouKnowMelloGotThat?™️ (@MelloGotThat) November 4, 2019
At least we know nobody is alone in being prejudiced against.
Final thoughts
Nowhere is safe and nothing is sacred.
But then again, bastions of hope emerge all over the East Coast and shine brighter than carbon. Here’s what we know for sure:
- it takes 2.9% of hateful tweets to go from most to least racist states;
- there’s Vermont potential in every one of us.
When talking racism on Twitter, I personally like to think that in every Delawarian there's a Vermonter, trying to get out.