How to evaluate Instagram analytics to improve your performance


Instagram is a marketer’s favorite platform.
It’s not just that every month, a billion people use Instagram. It’s the Instagram’s ability to sell: 62% of users say that they become more interested in a product after they saw it on Instagram Stories and 130 million Instagram users tap on shopping posts per month.
These numbers show that Instagram is one of the best platforms for marketing your business.
However, it can be difficult to create a successful campaign. You need to watch the numbers, find ways to attract customers and grow your audience.
Fortunately, Instagram analytics lets users evaluate and improve their performance. The platform has a load of metrics that you can use to find out what works and what doesn’t. So, here’s what you need to know:
Instagram profile analytics
Instagram profile analytics refers to the metrics related to your Instagram profile. If you click the Insights button you’ll be able to view three main types of metrics—activity, content, and audience.
Activity
The activity section aggregates the activities that took place on your site for the past week. It is divided into two main groups—interactions and discovery.
As its name suggests, the interaction metrics refer to how people engage with your account.
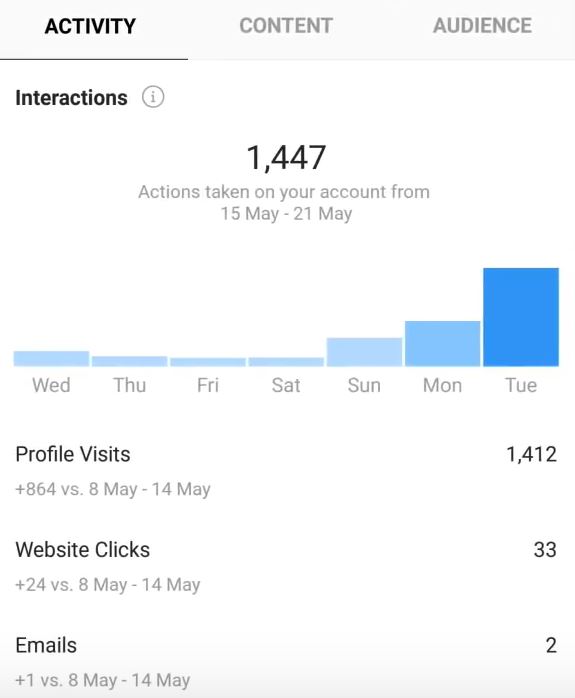
Here is a list of related metrics:
- Call or email clicks. This refers to the number of times that users clicked the call or email button in your bio.
- Profile Visits. The number of times people viewed your site in a week.
- Website clicks. The total number of clicks to links you've included in your Instagram profile’s bio.
The discovery section refers to the overall performance of your account for the past week.
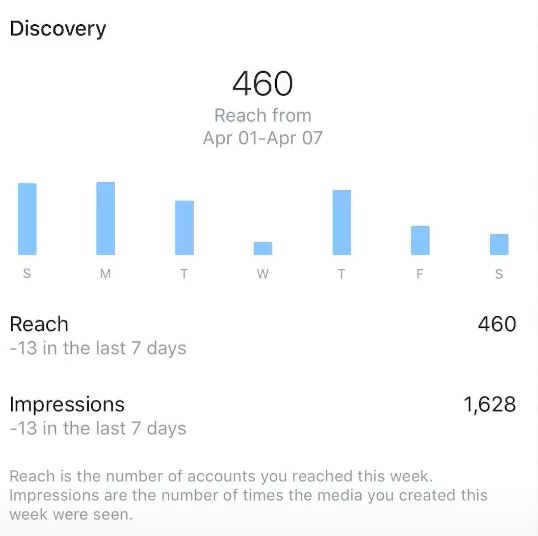
This includes the following metrics:
- Reach. This refers to the total number of unique users that have seen your Instagram story or post.
- Impressions. Measures the number of times that your posts were viewed on screen. If a user sees your post while browsing, then this counts as one impression. If one person viewed your post 3 different times in a day, then this counts as 3 impressions.
Impressions will always be higher than your reach because users tend to view your posts multiple times. A higher impression also shows that your content is resonating with your target audience.
Content
Content lets users know the performance of the content that you have published.
For starters, there are three main types of content posted in your account. These include the following:
- Stories. Refers to Instagram Stories.
- Feed posts. Refers to the photos and videos you posted on Instagram.
- Promotions. Refers to sponsored posts that you paid to promote.
The content is usually arranged in terms of performance. You’ll see your top-performing content and low performing content as you scroll to the bottom.
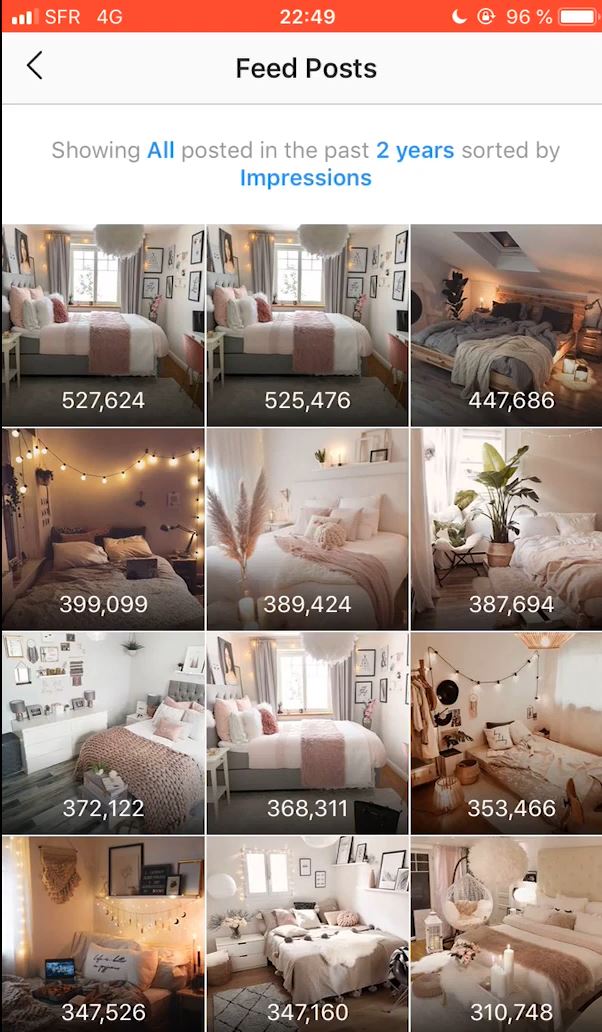
You can filter the type of content (photos, videos, shopping posts), metrics (impressions, reach, comments) and the time it was published (30 days, 3 months, 6 months).
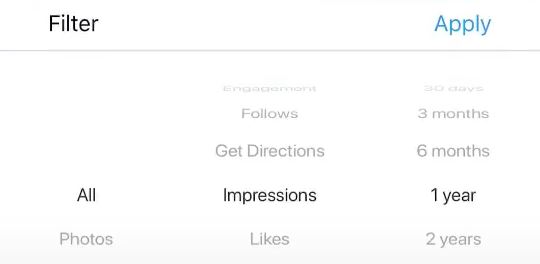
If your social media strategy is to create posts that get more engagement, you may want to filter posts with the most comments for the past month. Marketers who want to ensure that their social media budget is well-spent could filter shopping posts and compare them in terms of performance.
Audience insights
Identifying your audience is crucial to the success of your social media campaign. This information can help you understand your audience and help you monitor the growth of your audience from the past week.
A set of graphs includes the age breakdown and gender breakdown of your followers. Your audience’s location and the time that they use on their account is crucial for businesses launching sponsored posts.
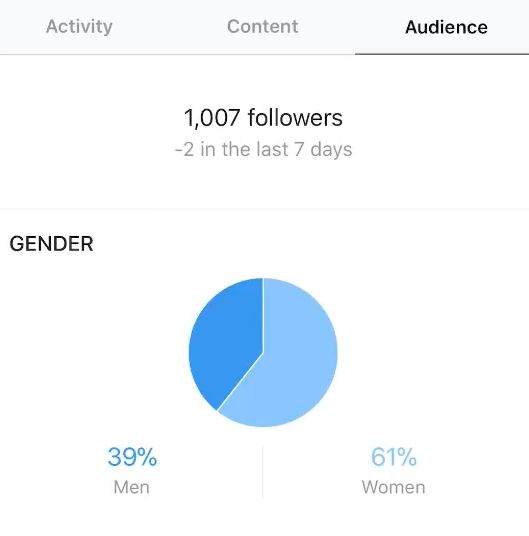
In the example below, a big majority of the account's audience is from Seattle. They are usually millennials in the age range of 25 to 34, followed by adolescents in the age of 18 to 24.
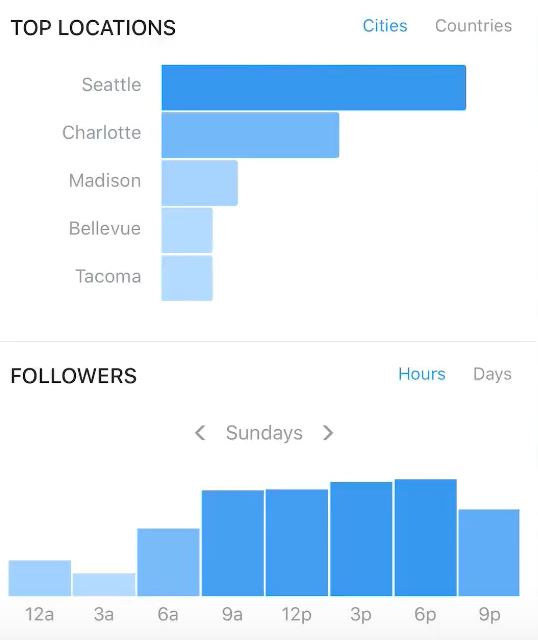
This means that you should probably use hashtags that are trending in Seattle. If you want to increase your audience in Charlotte, then use local Instagram hashtags and celebrate their holidays or events.
You should also post your content when your followers are the most active. The first hour that a post is published is crucial because the platform will assess its relevance based on immediate impressions, likes and engagement that it gets from its followers.
If it gets a lot of likes, it will show up in more feeds. However, if it gets a dismal number, it is less likely to show up for other followers. So, schedule your posts during the time that your target followers are most active to get the most engagement.
This can get tricky for international e-commerce stores that deliver to various time zones. The quick solution is to publish posts several times a day to reach audiences in multiple countries or distant locations.
Instagram Stories
Instagram has an abundant number of posts, but Stories also contribute a huge chunk to the platform.
According to Instagram, 500 million+ accounts use Instagram Stories every day. One third (1/3) of the most-viewed Instagram Stories are created by businesses. It has become such a significant marketing material that 96% of US marketers plan to continue posting Stories ads in the next 6 months.
Analytics for Instagram Stories are usually placed at the Content section. These posts could usually be filtered or arranged based on impressions, reach, taps forward, taps back and so on. The data can help you find out how viewers engage with your Stories.
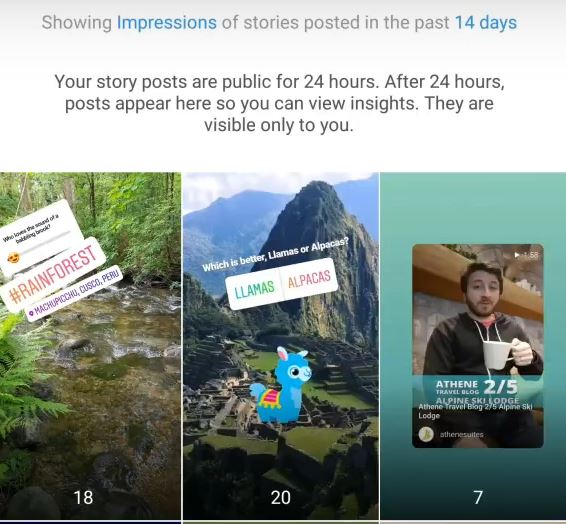
Here are some metrics under this category:
- Taps forward. This refers to the number of times users tapped ahead to the next story in the queue. Most followers “speed tap” to the latest story so this may not be a precise indicator for engagement.
- Taps backward. This refers to the number of times users went back to a previous story to watch the clip again because they might miss a few details.
- Exits. This refers to the number of times that users swiped out of your story.
- Replies. The number of replies to your story which means more engagement.
Instagram Stories also has a “Swipe Up” feature that lets viewers get redirected to another page like a link to your businesses' website. This feature is exclusive to business accounts with 10,000+ profiles of verified profiles.

Whether you're clicking a blog post or a product page, the "swipe up" feature can help you determine which posts drive the most traffic. You can make the "Swipe Up" button more noticeable by adding arrows, text, and GIFs that point towards it. Experiment with different formats to get users to act.
Measuring your success
Since Instagram has a lot of metrics, then how can you measure success? Here are some tips you can use to monitor the progress of your campaign.
Measuring engagement rate
Many entrepreneurs and marketers want their accounts to get the most engagement, but what does this mean?
There is no precise way to calculate Instagram engagement. Hence, The Online Advertising Guide compiled several formulas to compare engagement across different Instagram accounts and social networks.
.png)
Sharelov - a marketing collaboration platform - also compiled an average engagement rate benchmark based on the number of your followers. Use this table to get a general estimate of your engagement rate.
.png)
For example, if you have 50,000 followers your engagement rate is likely at 1.62%. Those with 100,000 followers probably have an engagement rate at 1.55%.
Measuring audience growth rate
To understand how your brand's online presence is growing over time, calculate your audience growth rates.
Instagram Insights' audience section has a list of the exact number of followers in your account. This lets you learn the amount of followers that you gained since the past week. This is based on the number of people who followed and unfollowed you.
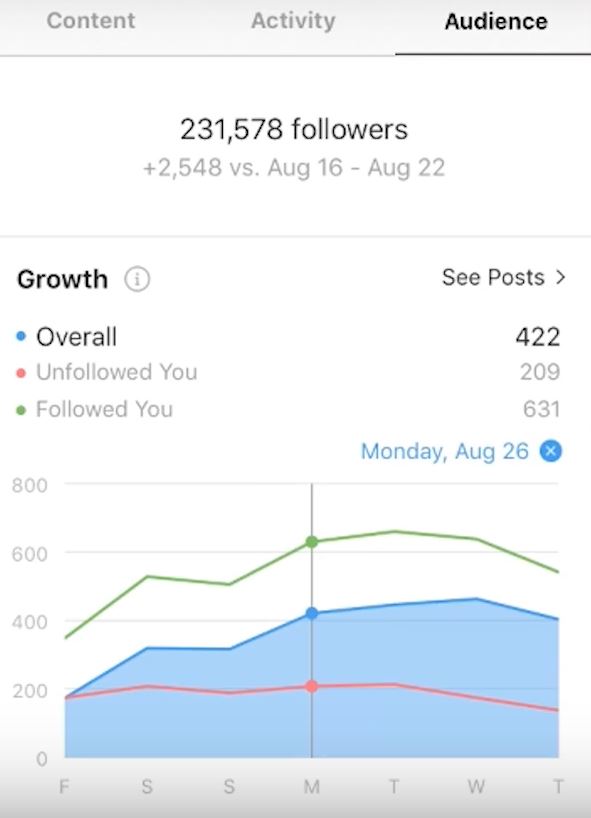
It’s ideal to keep track of the number of followers that you’ve gained per month in a spreadsheet. Use this data to figure out the precise growth percentage over time in your account.
If your followers are rapidly increasing, assess the social media campaigns or posts that you’ve recently posted. You can use this as inspiration to grow your following.
Implement various Instagram campaigns to find out what works and modify your strategy accordingly.
Measuring conversion rates
Determining your Instagram marketing campaign’s impact on conversion rates involves using Google Analytics and Instagram Insights.
You can easily find the number of people who clicked the link in your bio or swiped up in your Story through Instagram Insights. However, you’ll need additional help to use Google Analytics to discover what happens once they visit their website.
How much time do they spend on the page? What percentage of visitors would click the CTA?
By using the right tools, you can find out how to modify your CTA, social media posts and landing pages to boost your results.
How will you evaluate Instagram analytics?
Instagram Insights has a lot of metrics that you can use to grow your audience and become a successful brand.
If you’re not utilizing research-backed data, your strategy will fluctuate at random. You’ll create a social media campaign and keep your fingers crossed to ensure that it’s the right thing to do.
Fortunately, the numbers can provide answers. You can evaluate Instagram analytics to improve your performance and modify your existing strategy.
How are you using Instagram to evaluate your marketing campaigns?
Let us know in the comments below.