A beginner's guide to Facebook analytics and insights: what you need for social media marketing

Article summary
In this article, we explain how to use Facebook analytics and what their metrics can show you, In addition to that, we recommend tools that help you get more information and insights for your Facebook marketing strategy,
14 minutes read
- Page Insights
- The Page overview tab
- The Posts tab: the impact of your posts
- The Audience tab: who sees your content
- Facebook Insights in Meta Business Suite
- Results: your Page's performance
- Audience: who see your content
- Content: how your content performs
- Social media marketing tools for Facebook analysis
- In conclusion
Marketing your business on Facebook is one of the most effective ways to reach and target audiences through social media. With 2 billion monthly active users, it’s no wonder how Facebook is able to reach such a massive audience.
However, in order to achieve successful results with your Facebook marketing efforts, it’s important to fully understand and take advantage of the platform’s analytics tools.
Facebook is constantly changing the way it presents its analytics and the volume of data and insights it's willing to share.
Generally, it provides you with insights into which members of your audience engage with your page the most and helps you understand how your content and overall Facebook strategy are performing.
It’s crucial to measure the results and success of your marketing efforts on Facebook to see what areas in your strategy need improvement. Using Facebook Analytics can help you significantly boost your social media marketing performance.
Currently, there are two ways to access Facebook Analytics: through Page Insights and Meta Business Suite. The insights they provide often overlap but they have different ways of presenting them.
Facebook’s Insights caters to provide the best user experience along with an impressive amount of valuable data for businesses to take advantage of. It aims to give you a quick understanding of your social media marketing strengths and weaknesses.
The Insights tab in Meta Business Suite gives you a bit more perspective and shows how potential advertising and content changes can improve your results.
The massive amount of data can be fairly overwhelming for those who’ve never used it before. Are you new to Facebook analytics and insights? No worries, we’ve got you covered with all of the basics to help you become a Facebook marketing pro!
Page Insights
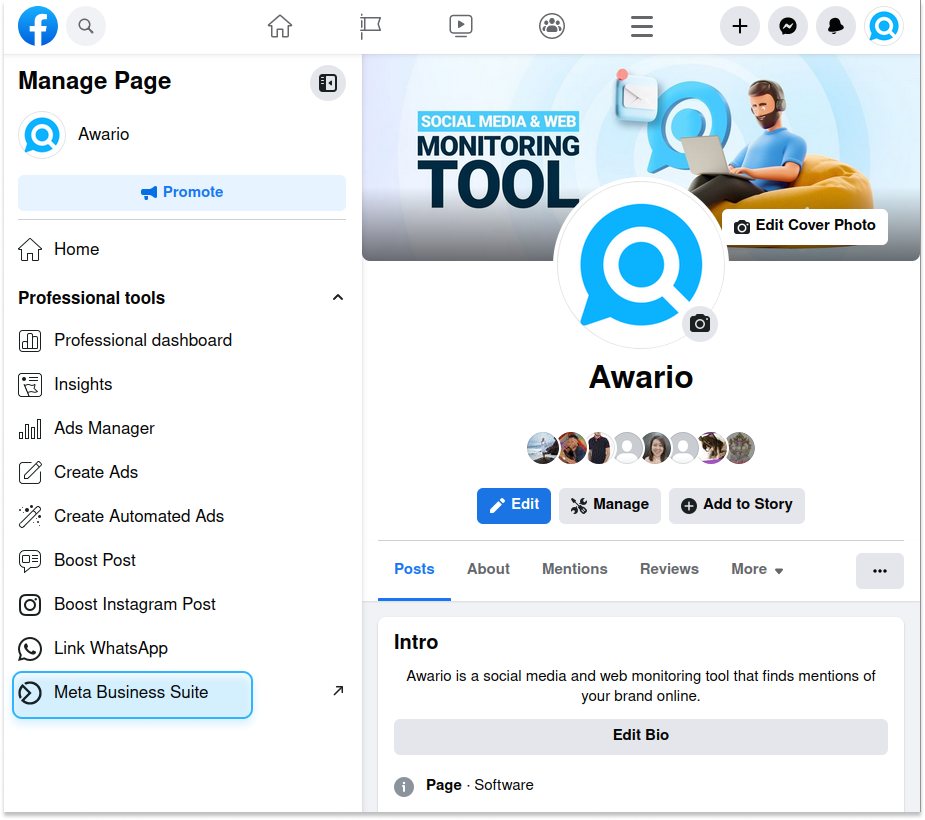
First, let’s go over how to access to the Insights tool on Facebook. Simply go to your Facebook page and click on ‘Insights.’
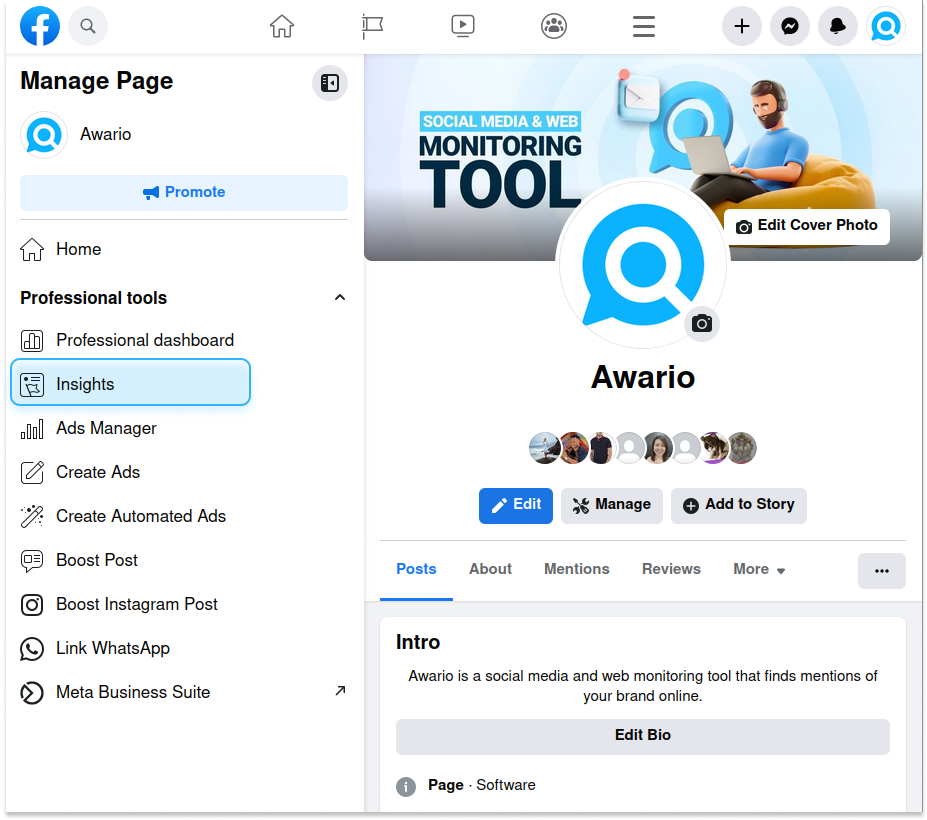
From there, you’ll be able to see an overview of your page and more detailed insights on your Page, Posts, and Audience as well as your Top Performer - the post that got the highest number of impressions, reach, and engagement.
Let's examine these three categories of Facebook insights one by one.
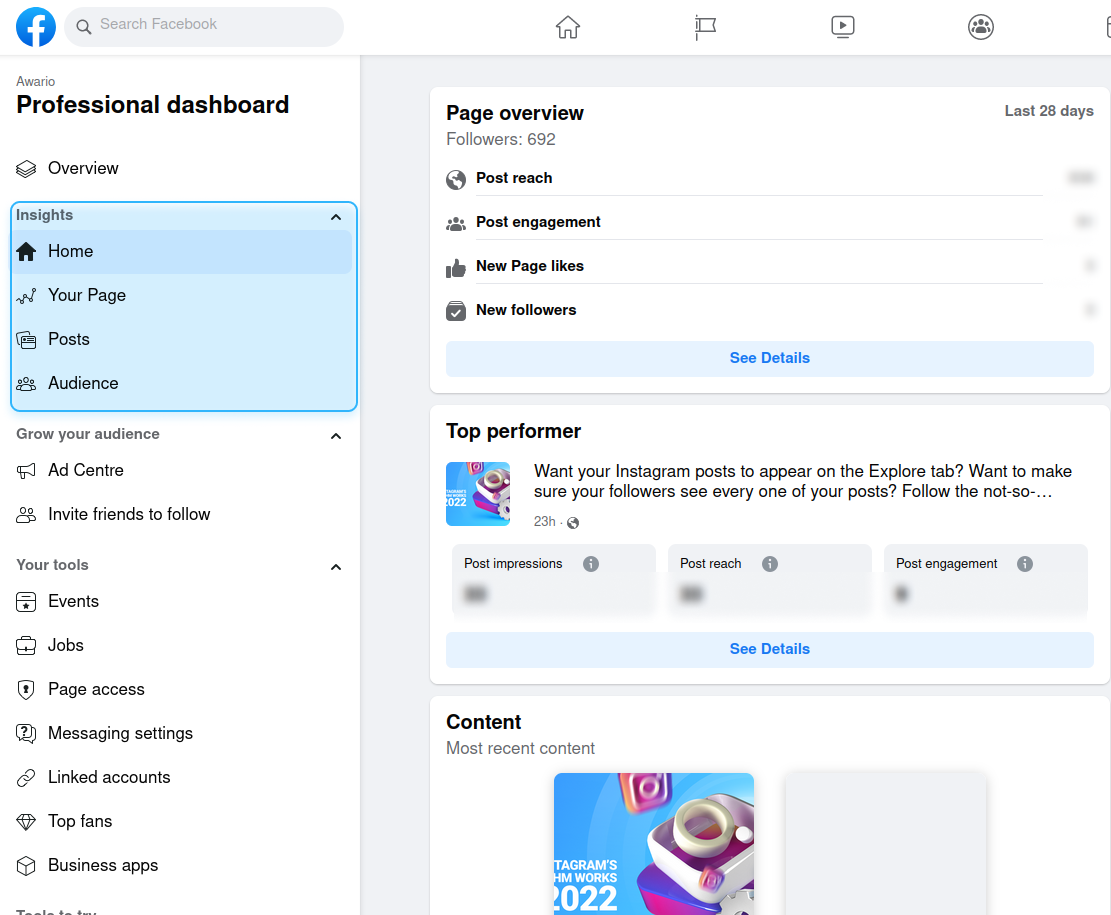
Page overview
Page overview gives you the most important Facebook metrics for the last 28 days.
These metrics include:
-
Post reach: how many people saw your posts
-
Post engagement: how many people interacted with your posts through reactions or comments
-
New Page likes
-
New Page followers
-
Reactions: how many reactions you've got
-
Comments: how many comments you've got
-
Shares: how many times your posts have been shared
-
Photo views: how many people clicked on the photos you shared
-
Link clicks: how many people clicked on the links you share
-
Hide all posts: how many people clicked to hide your posts from their timeline
-
Unfollows: how many people unfollowed you
With the recent update from Facebook, you can no longer change the time frame for these metrics or export the raw data - not from this page at least.
As you can see, these Insights allow you to quickly evaluate how your content performed in the last month and whether you were able to reach your goals or not.
Posts
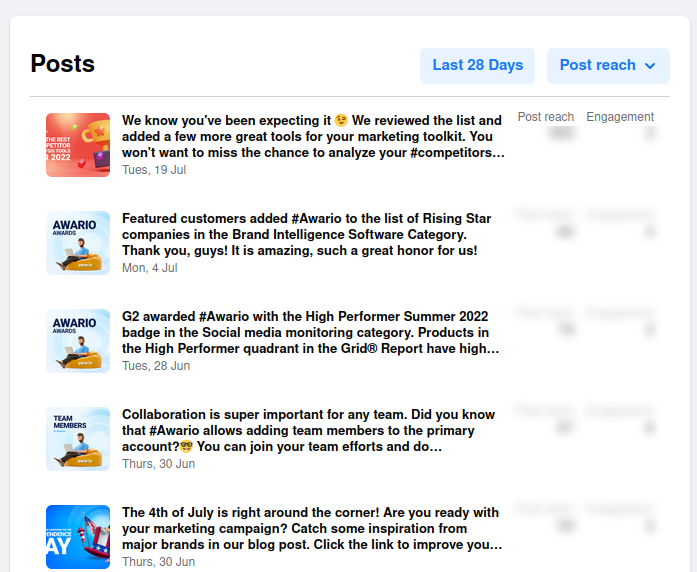
This section shows you your posts for the previous 90, 28, or 7 days. You can sort them by date, reach, or engagement. In the first case, you'll see your latest posts first. If you choose another option - you'll see the most successful posts in terms of reach or engagement on top of the page.
Here Facebook also shows engagements and reach for each of the posts in the list.
As in the previous tab, there's no way to export the data or compare it with previous results. The tab aims to give you a quick glance at the most successful posts in a certain time period and the basic metrics for each post.
By signing up I agree to the Terms of Use and Privacy Policy
Audience
This tab shows you the basic demographic insights of your followers. You can see the following data:
- The breakdown of your followers age
- Their gender
- Top 10 cities your followers come from
- Top 10 countries your followers come from
Basically, at one glance you can tell where people who see your content come from, what age groups they belong to, and if there's a strong preference between women or men for your content.
This is where Page Insights's capabilities end.
To get more information, to see your Facebook strategy's performance over time, and to export data, you need to go to Meta Business Suite.
Facebook Insights in Meta Business Suite
Meta Business Suite is where you should go to properly analyze your Page's performance. Basically, if you have more than three minutes to look at your insights, you should open Business Suite.
To do that, click on the last tab on the left side panel - it will take you to the business suite.
Insights here are divided into five tabs: Overview, Results, Audience Benchmarking, and Content. They each have unique features and can be used for different purposes.
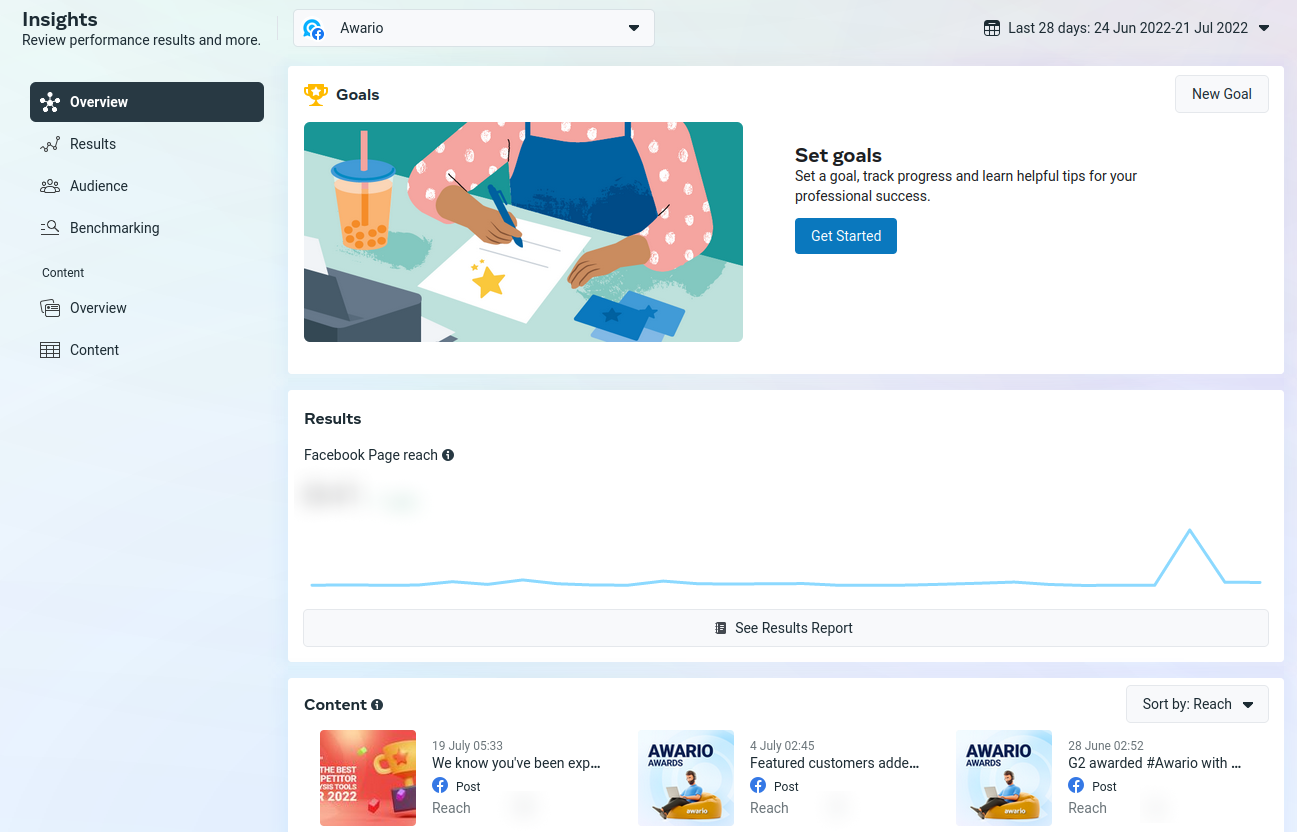
The Overview page shows you the reach of your page, best-performing content, and your audience.
You can set a goal here, for example, to reach more people or to get new followers. Facebook then will give you recommendations on how to reach your goal (while heavily encouraging you to invest in Facebook ads).
Note that here you can set a custom time frame for the data unlike in Page Insights.
Results
The Results page shows you:
-
Facebook Page reach
The number of people who saw any content from or about your Page, including posts, stories, ads, social information from people who interact with your Page, and more.
-
Facebook Page visits
The number of times that your Page was visited.
-
New Facebook Page likes
The number of new likes of your Facebook Page.
How does it differ from the information we can see in the Page Insights?
Well, first of all, here you can choose a time frame for your data, be it the last 7 days, a specific period, or all the data since the launch of your page.
Secondly, Facebook automatically compares this data to the previous period of the same length and shows whether your metrics grew or decreased. That way you can finally see if your Facebook strategy pushes you forward, keeps you in place, or prevents you from actually reaching your goals.
And finally, here you can export the data in three formats: CSV, PNG, and PDF.
Audience
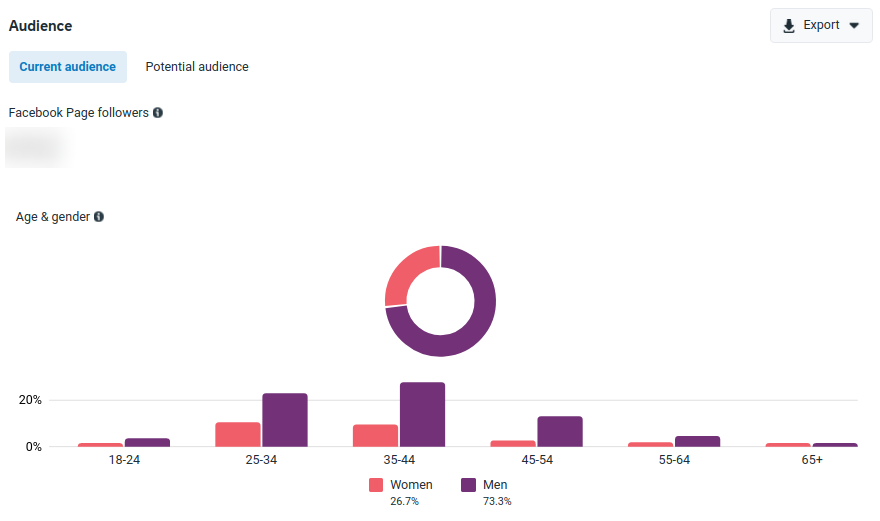
This tab basically gives you the same info as Page Insights: age, gender, and location, but the data is more detailed. Once again, here you can change the time frame and export the insights in a preferred format.
The Potential audience tab shows what kind of people you can reach based on your existing audience, and previous ad campaign settings. Basically, it shows you the size of a potential audience for your future ad campaigns (and its characteristics).
By signing up I agree to the Terms of Use and Privacy Policy
Content
The Content tab is divided into two pages: Overview and Content.
The Content page shows you all the posts and stories from a chosen period and their:
- Reach
- Reactions
- Sticker taps (for Stories)
- Replies (for Stories)
- Link clicks
- Comments
- Shares
-
Results i.e. the number of times that your ad achieved an objective you selected (for Boosted posts)
- Cost per result
You can sort the list by each of these metrics. For example, if you want to see which posts brought traffic to your website, you can sort the list by link clicks and check the top five.
You can also remove Ads, Posts, or Stories from the list to focus just on one type of content.
The data here is exportable.
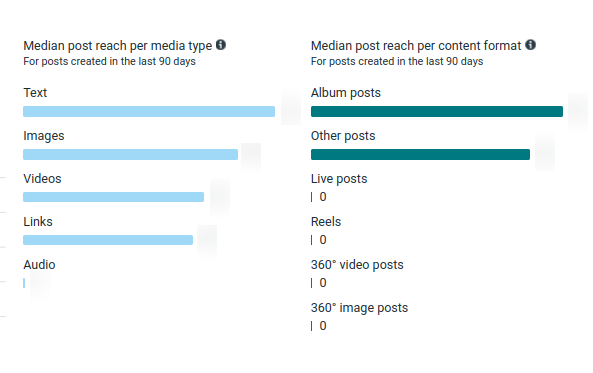
The Content Overview page depicts your posts' organic reach and engagement. It benchmarks the data from the chosen period against the previous period of the same length and shows you how your performance has changed.
In addition to that, it shows what median types and content formats were most successful.
Benchmarking
In the benchmarking tab, you can add the pages of your competitors and see how they perform.
You can see how many Page likes they currently have, how much this number grew (or diminished) during a certain period and how many content assets they published in a chosen time frame.
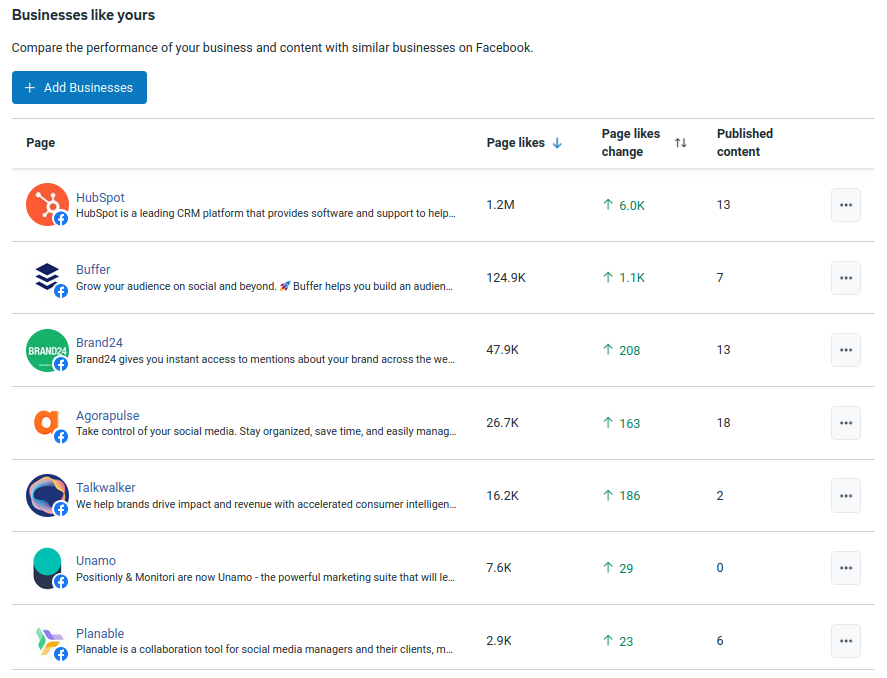
Here Facebook can also suggest tracking pages that it deems similar to yours.
At the moment, that is all the insights Facebook gives you. But what if you need more?
Luckily, there are social media marketing tools that provide Facebook analytics and can give you more data insights to guide your Facebook strategy.
Social media marketing tools for Facebook analysis
Awario
If you need to take a closer look at your Facebook mentions, Awario's Facebook monitoring is here to help!
Not to toot our own horn, but the tool provides a plethora of valuable marketing insights and gathers all your Facebook mentions in one place. Moreover, Awario supports other platforms including Instagram, Twitter, YouTube, media websites, and so on, so you can enrich your analysis with the data from elsewhere.
The insights available in Awario include
- Age
- Gender
- Type of a Page (belongs to a person or a business)
- The sentiment of the mentions
- Reach
- Top pages mentioning you
It allows you to make up a comprehensive picture of who are the people and organizations that mention you on Facebook.
All the data is exportable and you can even build a social listening report and share it with your colleagues and stakeholders.
Due to Facebook's API limitations, you will only be able to see tagged mentions from Pages, not from ordinary user profiles. So it's more likely to analyze how other companies and influencers talk about you.
Awario offers a free 7-day trial so you can test out Facebook analytics without any commitment.
SocialInsider
With Socialinsider, you can understand Facebook insights and track all the meaningful metrics, like engagement rate, reach, impressions, followers’ growth, posts evolution, demographics, and much more.
Moreover, with this Facebook analytics tool, you can improve your Facebook strategies by comparing and benchmarking against top competitors, influencers, and top players from your industry.
Socialinsider is a Facebook analytics tool that can be used to:
-
get all the Facebook metrics in one single dashboard.
-
perform straight to the posts analysis on Facebook.
-
understand your Facebook's reach and engagement.
-
create Facebook benchmarks and compare with top competitors.
-
understand your videos' performance.
-
download presentations - ready templates as Excel, CSV, Powerpoint or PDF.
-
import Facebook data to Google Data Studio.
And much more.
There’s a 14-days free trial so you can test it out!
Hootsuite
Hootsuite Analytics offers a complete picture of all your social media efforts in one place. This simplifies your social media analytics work. It saves time and makes it easy to compare aggregate results across networks.
You’ll see key metrics for each of your social posts, including:
-
Clicks
-
Comments
-
Reach
-
Shares
-
Video views
-
Video reach
You’ll also see metrics for each of your profiles, including follower growth over time. You can select the metrics that matter most to you so you can see all the relevant results at a glance.
You can also see suggestions for the best times to post based on your account’s historical performance.
In conclusion
Facebook is constantly changing its platform - what doesn't change is our need for data-based insights to make strategic marketing decisions.
By carefully studying Facebook's analytics and utilizing additional tools to support you where Facebook won't, you can empower your Facebook marketing strategy. You can easily spot your mistakes and fix them or double down on the content and activities that work and bring the results you need.
That's why social media analytics are truly the cornerstone of social media marketing - they show you what to do to achieve your goals. And if you pay attention, your success is right around the corner.